

GrafiQ - BI RH : Visualize Your Data with Intuitive Graphics Tools
GrafiQ - BI RH: in summary
GrafiQ empowers data enthusiasts and businesses with intuitive and precise tools to transform complex data into visually engaging graphics. Ideal for analysts and marketers, GrafiQ stands out with its seamless integration capabilities and real-time updates, ensuring your data always tells the right story.
What are the main features of GrafiQ?
Seamlessly Integrate with Multiple Data Sources
Connecting to numerous data sources is now a breeze with GrafiQ. This feature is designed to eliminate the hassle of data management, allowing for effortless integration without the need for complex configurations.
- Connects easily with popular databases and APIs
- Automates data syncing to keep information up-to-date
- Supports a wide range of file formats for data import
Create Stunning Visualisations Effortlessly
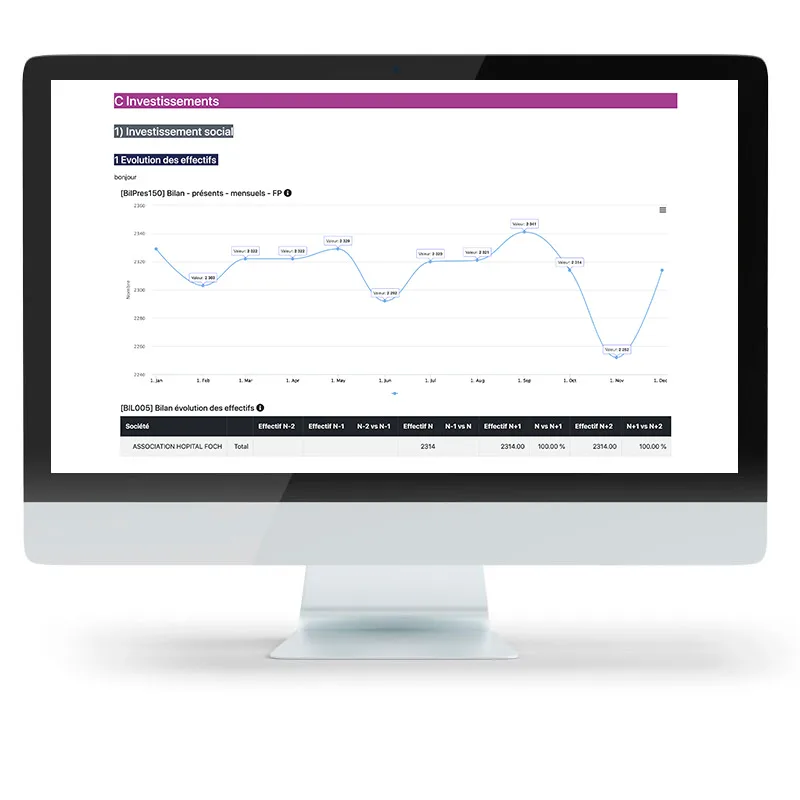
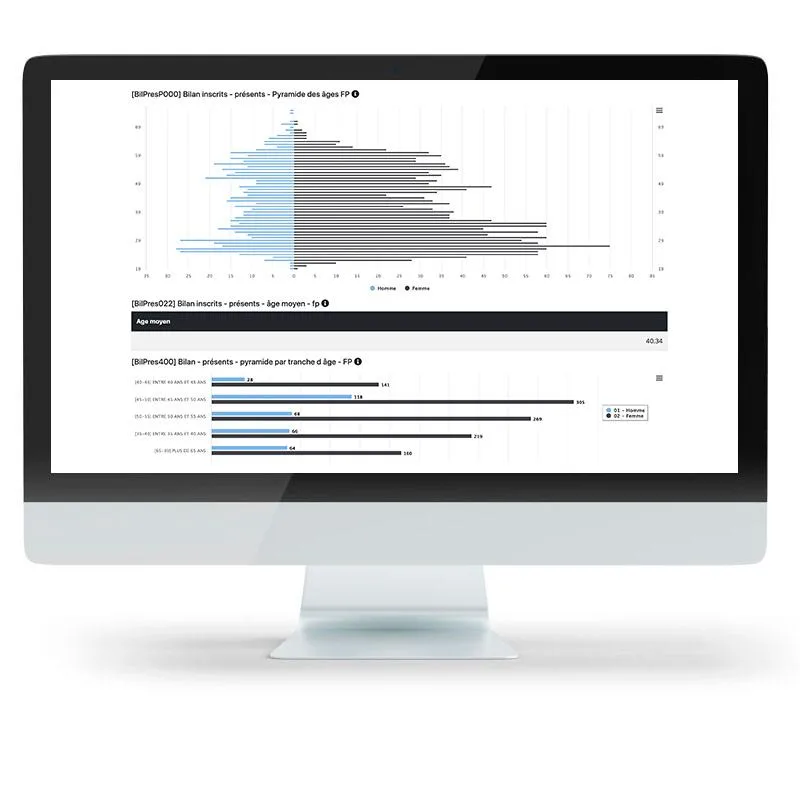
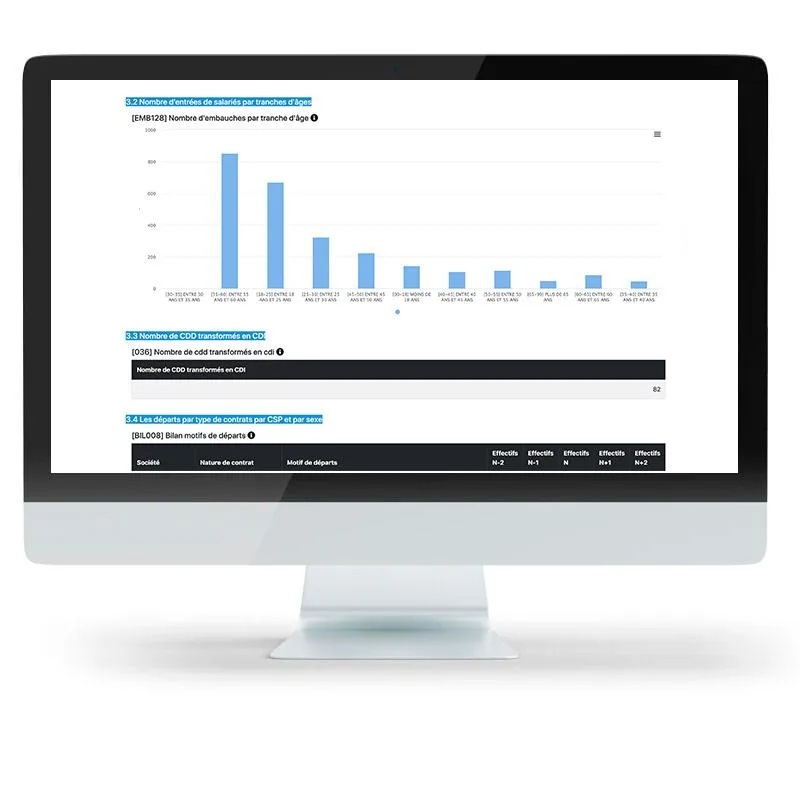
GrafiQ makes it simple to design visualisations that not only look impressive but also convey meaningful insights. With a variety of templates and customisation options, this feature ensures your visualisations capture and communicate your data’s essence.
- Diverse range of chart types including bar, line, and pie charts
- Customisable design elements for personalised graphics
- Interactive features to enhance data exploration
Collaborate and Share Insights Instantly
Collaboration is at the heart of GrafiQ, enabling teams to work together to generate insights. This feature ensures that insights are accessible and shareable, fostering a culture of data-driven decision-making.
- Real-time collaboration tools for team projects
- Easy export options to share graphics via email or social platforms
- Permission settings to control access levels for team members
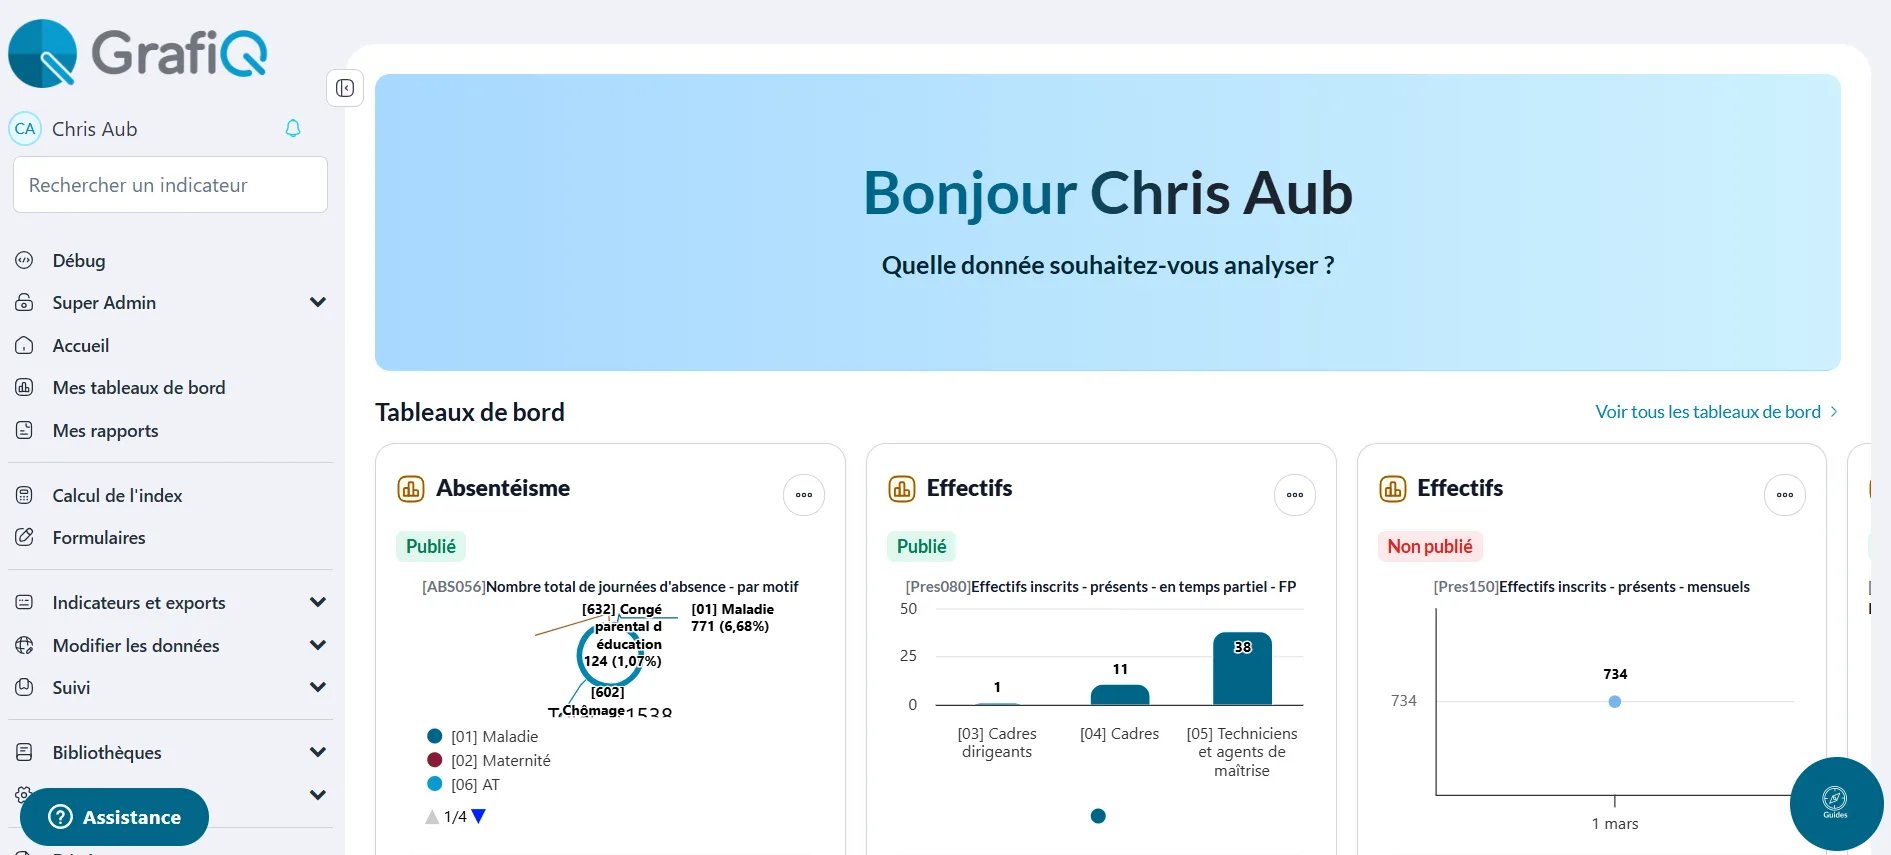
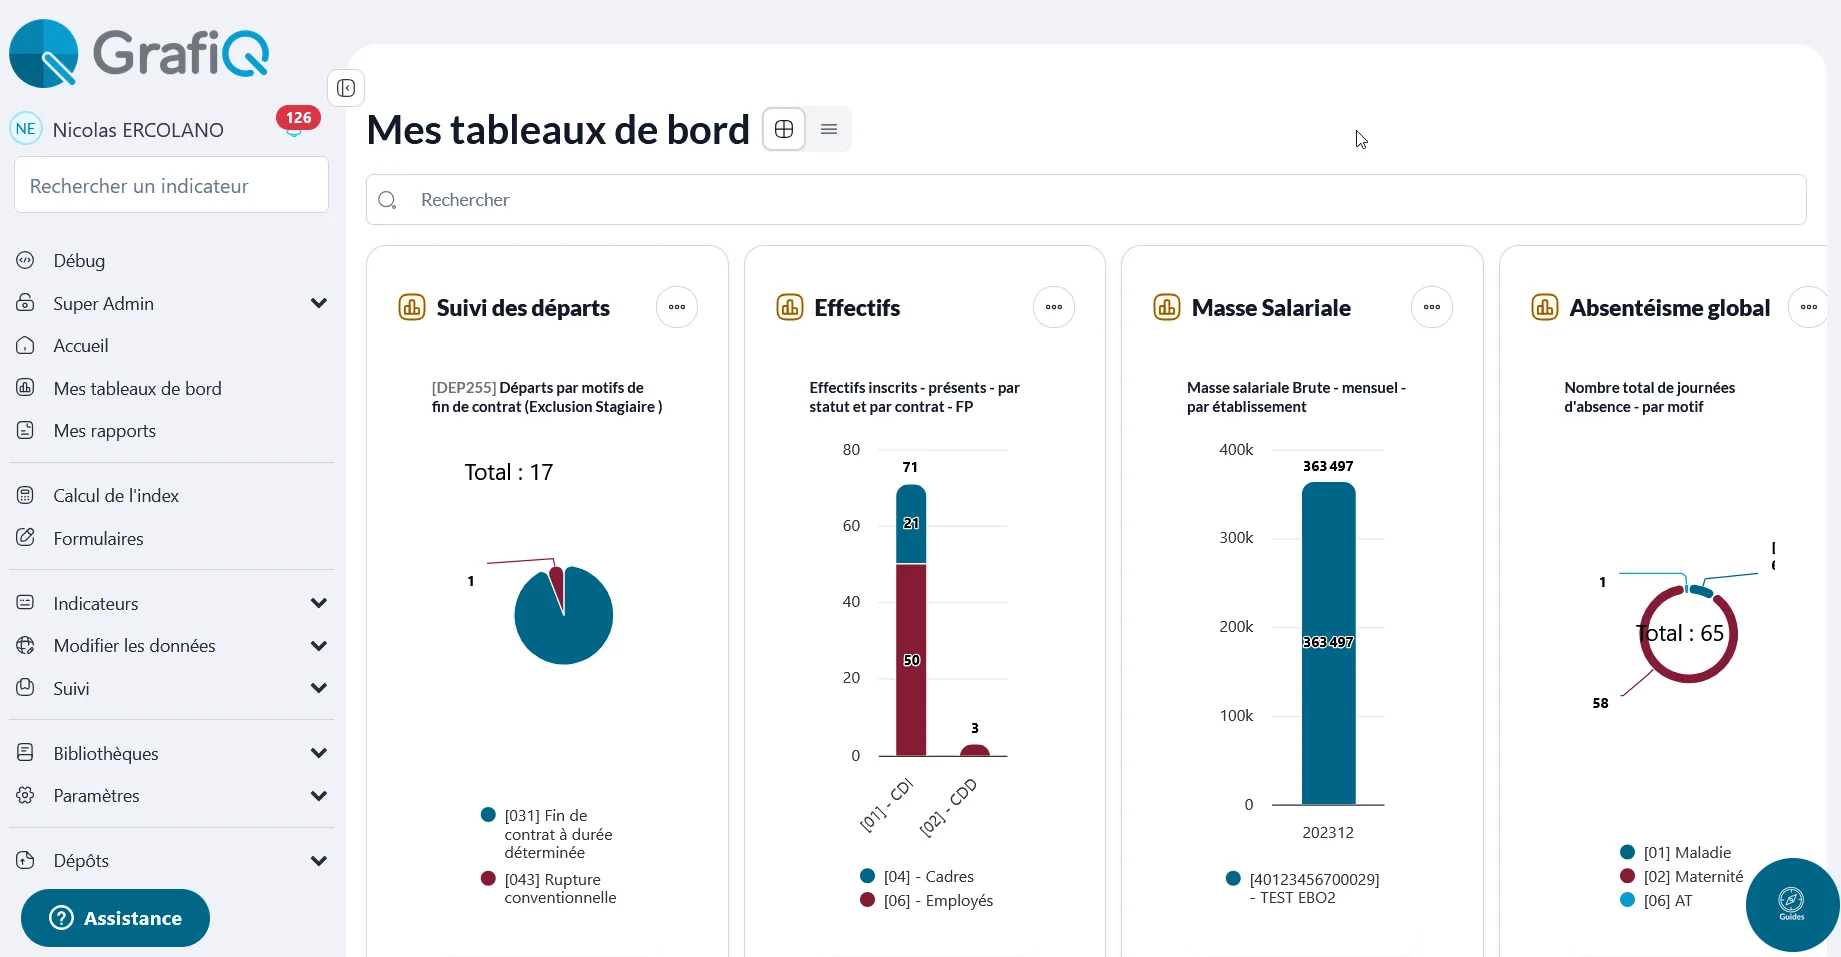
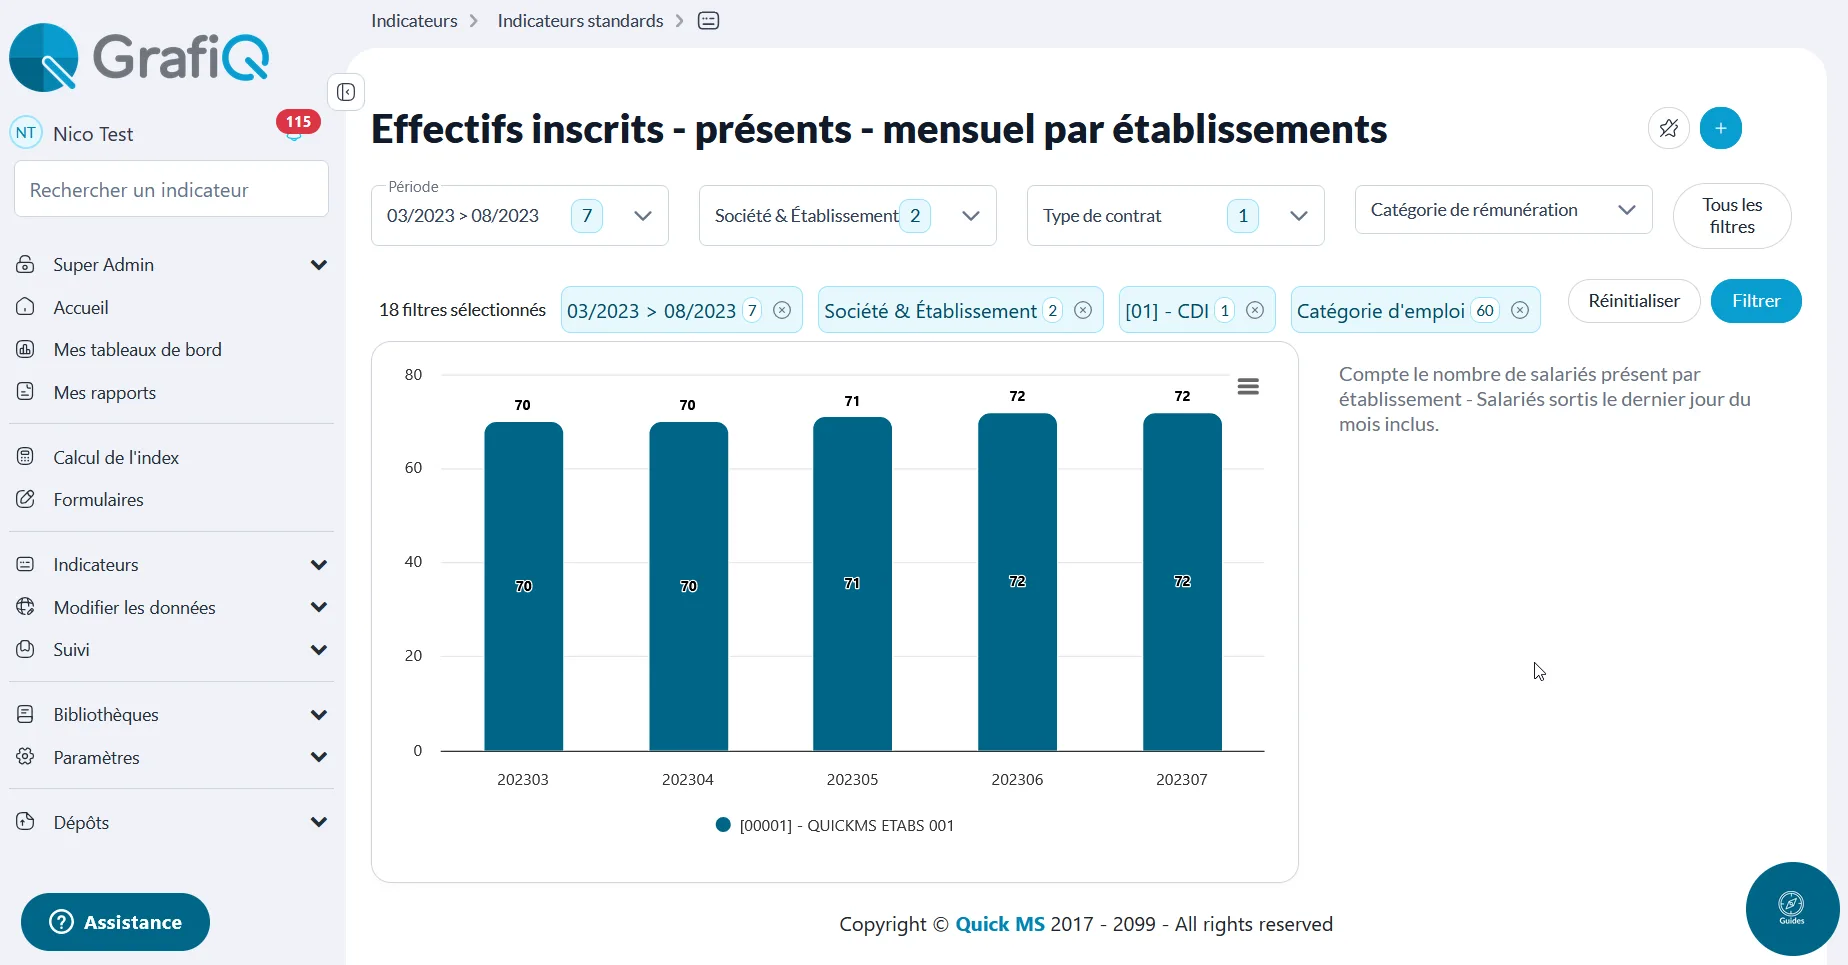
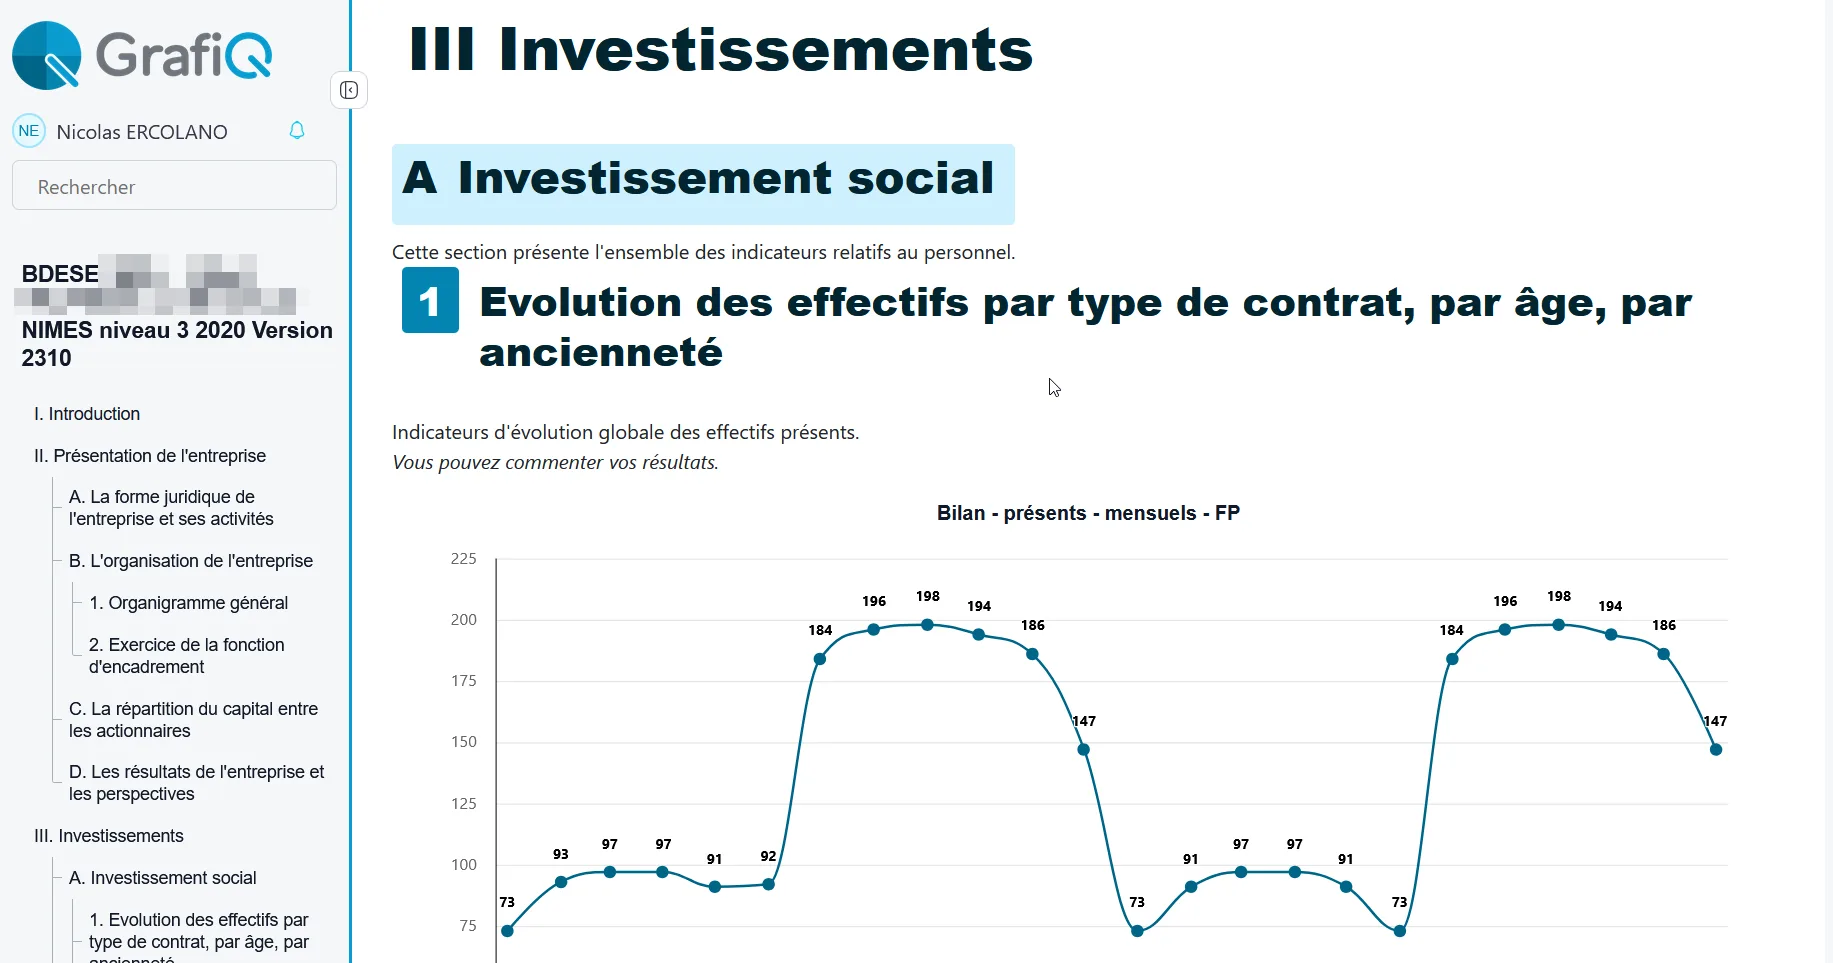
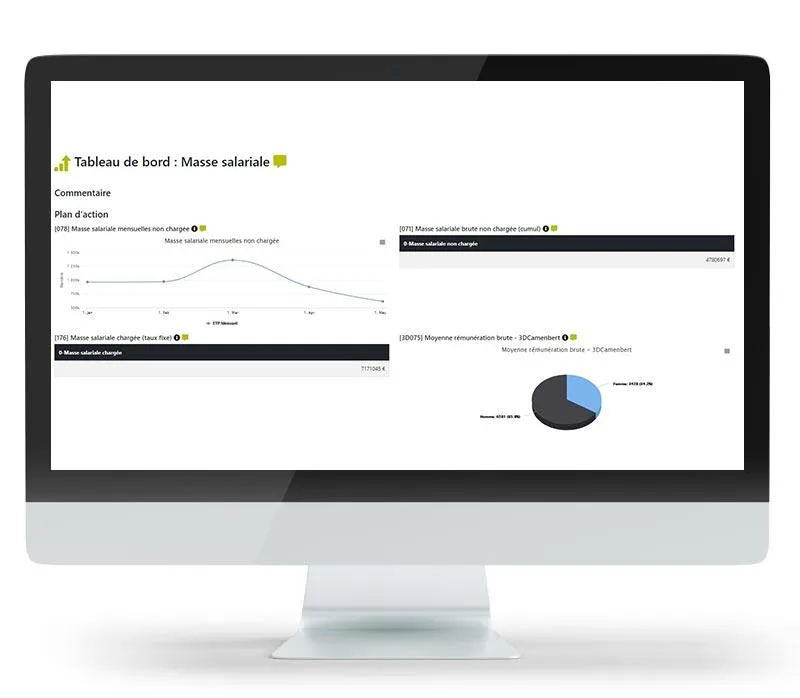
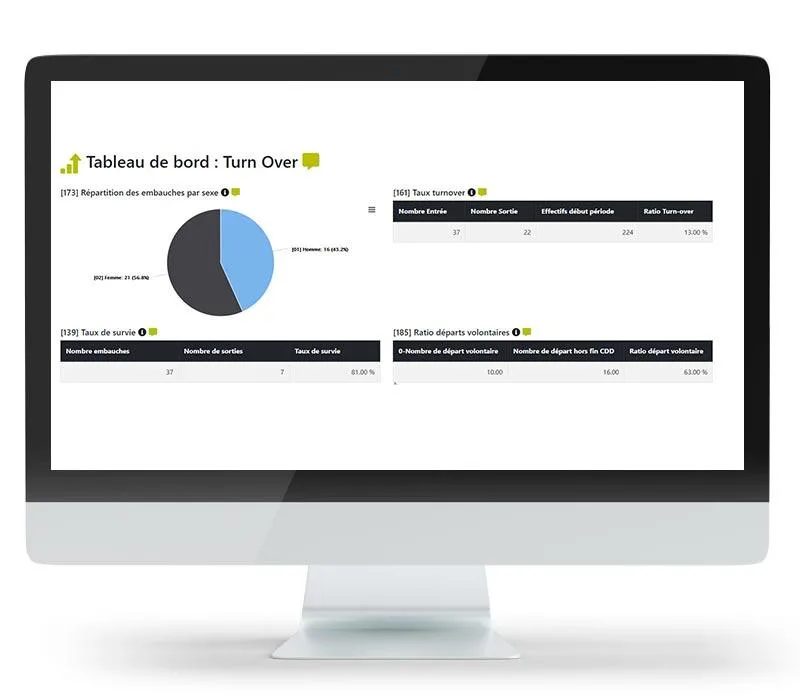
Screenshots
GrafiQ - BI RH: its rates
QuickMS Essentiel
Rate
On demand
Module Suivi
Rate
On demand
Module Organisation
Rate
On demand